Using Application Insights in order to keep track of your Azure Functions
The last two posts had me writing about how logging can be implemented in your Azure Functions and how you can reuse class libraries using a different logging library, like log4net. You probably already have some logging- and monitoring system in place, but if you’re starting to use Azure Functions (or any other Azure service for that matter), the best tooling to use is Application Insights, in my opinion. You don’t even have to use Azure services in order to use Application Insights. You can also integrate it with any other on-premise server or client application.
For those of you who aren’t yet familiar with Application Insights, you should check it out immediately! It’s an awesome tool in Azure which enables you to view logging, metrics, exceptions, performance and more of your applications. It’s also possible to create enormous dashboards, reports and alerts, so everything you need in order to monitor your applications. A real must-have for a professional devops team.
Integrate with Azure Functions
Integrating your Azure Functions (Function App) with Application Insights is pretty straightforward.
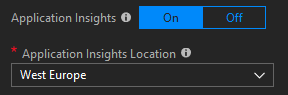
The easiest way is to integrate is by selecting Application Insights when creating a Function App. Just press On, the location you want it deployed and proceed with creating the Function App. This will make sure the newly created Application Insights instance will be used by your Function App.
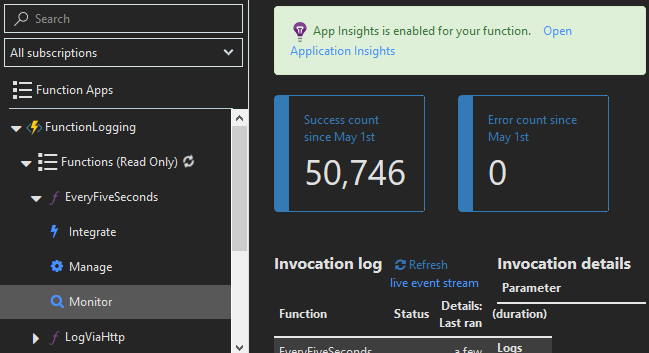
If you have neglected to turn this feature on, or have decided you want to use Application Insights after the Function App has been created, no worries you can still turn on this feature. If you need to integrate it manually, you should navigate to the Application Settings of your Function App and add a new entry with the key name APPINSIGHTS_INSTRUMENTATIONKEY and the value has to be the Instrumentation Key which can be found on the overview page of your Application Insights instance.
Having done so, you will immediately see a new notification popping up on the Monitor page of your Azure Function stating you can now check out your monitoring over there!
That’s all you need to do in order to integrate a Function App with this awesome monitoring system. Your operations people will be grateful for adding this to your solution.
Why add it?
‘Easy to add’ isn’t a very compelling reason to add Application Insights to your Function App. But if you take a moment to check out all of the basic features, I think you will see the power of this tool.
All of the metrics!
Just taking a look at the Overview page is fascinating already. Over here you are able to see how many server instances are running at this time, the response times of your functions and how many requests are being handled at a specific timespan.
![clip_image001[5]](https://jan-v.nl/files/ec2c41be-d9fb-4d6a-8541-09c9349b03f7.png)
Clicking on either one of these graphs will show you even more details!
I like the Live Stream option a lot, because it gives me the feeling I’m an uber-cool-operations-guy by showing me a lot of graphs and telemetry data which gives you a good first impression of the status of your application.
![clip_image001[7]](https://jan-v.nl/files/e3d16761-c160-42e6-acea-2391d82477ce.png)
I know it can be quite overwhelming at first. Just spend a couple of minutes clicking and investigating all of the options is enough for most developers to understand what’s going on and which information is useful for your job.
One of the other useful pages available is the Performance page, this is especially useful if you’re providing public HTTP triggered endpoints via your Azure Functions.
![clip_image001[9]](https://jan-v.nl/files/fee298af-9838-4c91-bbe6-51568ace6642.png)
You can do some filtering, selecting timespans and inspect a lot of other metrics which have to do with performance of your piece of code.
Logging & Exceptions
Even though all of those metrics are useful in a production environment, as a developer I don’t do a lot with all of this information (mostly because I don’t have permission to view this data in Production).
What I do find interesting though is the availability of logging and being able to query through it quite fast. As I already mentioned, all of the Azure Function logging is stored in Application Insights (if configured) and you are able to search through all of this logging in the Search page. This is the main reason why I’ve spent some time in configuring log4net with a special appender in order to see ALL of my logging in Application Insights.
Just head down to the Search page and you’ll see all of the logging which has occurred in a specific interval.
![clip_image001[11]](https://jan-v.nl/files/1cc6601c-7dc3-4503-a4b4-07f96390bd7e.png)
Obviously, you can change these filters and interval if you want to investigate some stuff. Most useful, to me, is the filtering on severity level of my logging messages and of course, being able to track (unhandled) Exceptions which are a special type.![clip_image001[1]](https://jan-v.nl/files/d7b3fd62-d1b7-4040-bdd9-e362a5aff6de.png)
While this search page is great for doing some quick research and investigation, there’s an even more awesome page you can check out to see if there have been any exceptions. At this time, this page is labeled Failures. On this page you are able to see when exceptions have occurred and which type of exceptions have been thrown.
![clip_image001[3]](https://jan-v.nl/files/421fec5d-a7ce-4daf-999a-61df10c8366b.png)
Clicking on a specific exception will provide you with some more details.![clip_image001[5]](https://jan-v.nl/files/e2c0c076-1413-4869-984d-327a96b358bb.png)
Zooming in further on such an exception will provide you with a lot of information of the client, server and even the stacktrace of the exception.
![clip_image001[7]](https://jan-v.nl/files/98dcae05-8c10-4176-a4a8-2c39d478ee25.png)
As you probably know, having a stacktrace is crucial information to do some proper investigation on problems which have occurred in the past. Along with all of the other logging you can store within Application Insights it provides you with all of the tooling and analysis information to do proper monitoring and troubleshooting of your service(s).
One of the other features which I like very much is the ability to set Alerts when something fishy is going on, like an increase of exceptions or Errors/Criticals logged being stored. This way you don’t have to keep track of the dashboards all day, but get notified when there’s something important to look at. I’ve only scratched the surface of Application Insights so far. There are a lot of other things you can check out and configure in order to automate your DevOps workflow as much as possible.
I need more!
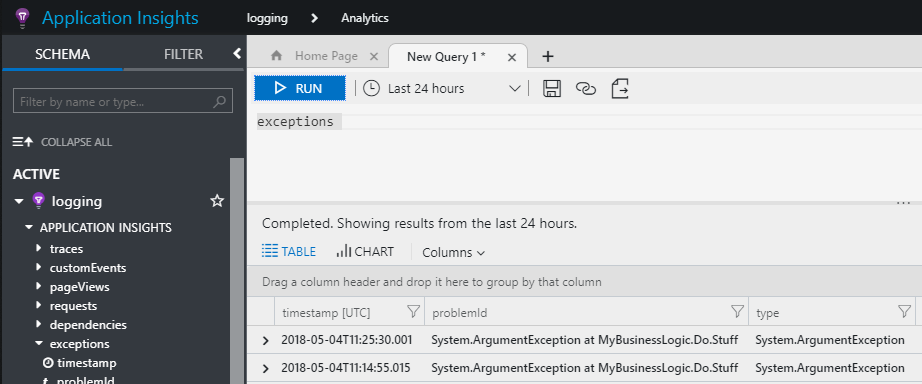
Even though I like Application Insights very much, I can image a ‘real’ operations persons will probably find it a bit too ’light’ as it might not provide all of the information they want to see. Well, no worries! The team has you covered and has added a button labelled Analytics on the overview page.
Pressing this button will navigate you to a new environment which is meant for power users of this system. You can do some SQL-like statements over here, create charts, query just about everything and visualize it just the way you want.
I’m not very familiar with this piece of tooling (yet), but it sure looks amazing and I know I’ll put some time in this as it appears to be even more powerful and useful compared to the ‘default’ Application Insights. My guess this piece has been built on top of the Kusto platform, which is an great piece of technology I’d like to get my hands on! I’ll be sure to follow up on these pieces of tooling, but for now I’ll leave it to this and hope I’ve triggered you in using Application Insights!