Build your own Fabric Capacity usage functionality
I use Microsoft Fabric on a project to store all customer data. Each customer gets their own workspace, so data is isolated. While Microsoft Fabric has its challenges and comes with a hefty price, it does bring quite a lot of useful data solutions under one umbrella. If you only need to store data in a (simple) database there are many more solutions that will fit your use case better. For my project we need to do ingestion, transformation, cleansing, store structured data, store unstructured data, etc. With all of these requirements, using Fabric makes more sense.
During development and testing we ran into capacity issues, which resulted in strange errors when querying or ingesting data.
To keep track of capacity usage you can install the Microsoft Fabric Capacity Metrics app from the store. This app provides useful insights, but it does require users to have a Power BI Pro license. If your users already have this, make sure to install the app. If not, you might want to get this for the users managing the solution, so be sure to discuss that.
I wanted to see if I could create something to deliver the same or similar insights. The Metrics app is based on the available data, so I figured it should be possible to query this myself too. Spoiler: it’s possible, but it does require a bit of setup.
The setup
My solution relies on the capacity events provided by Fabric. There are two types of events:
- Microsoft.Fabric.Capacity.Summary
These contain a summary of capacity usage over the past 30 seconds - Microsoft.Fabric.Capacity.State
Contains information about changes in the capacity state
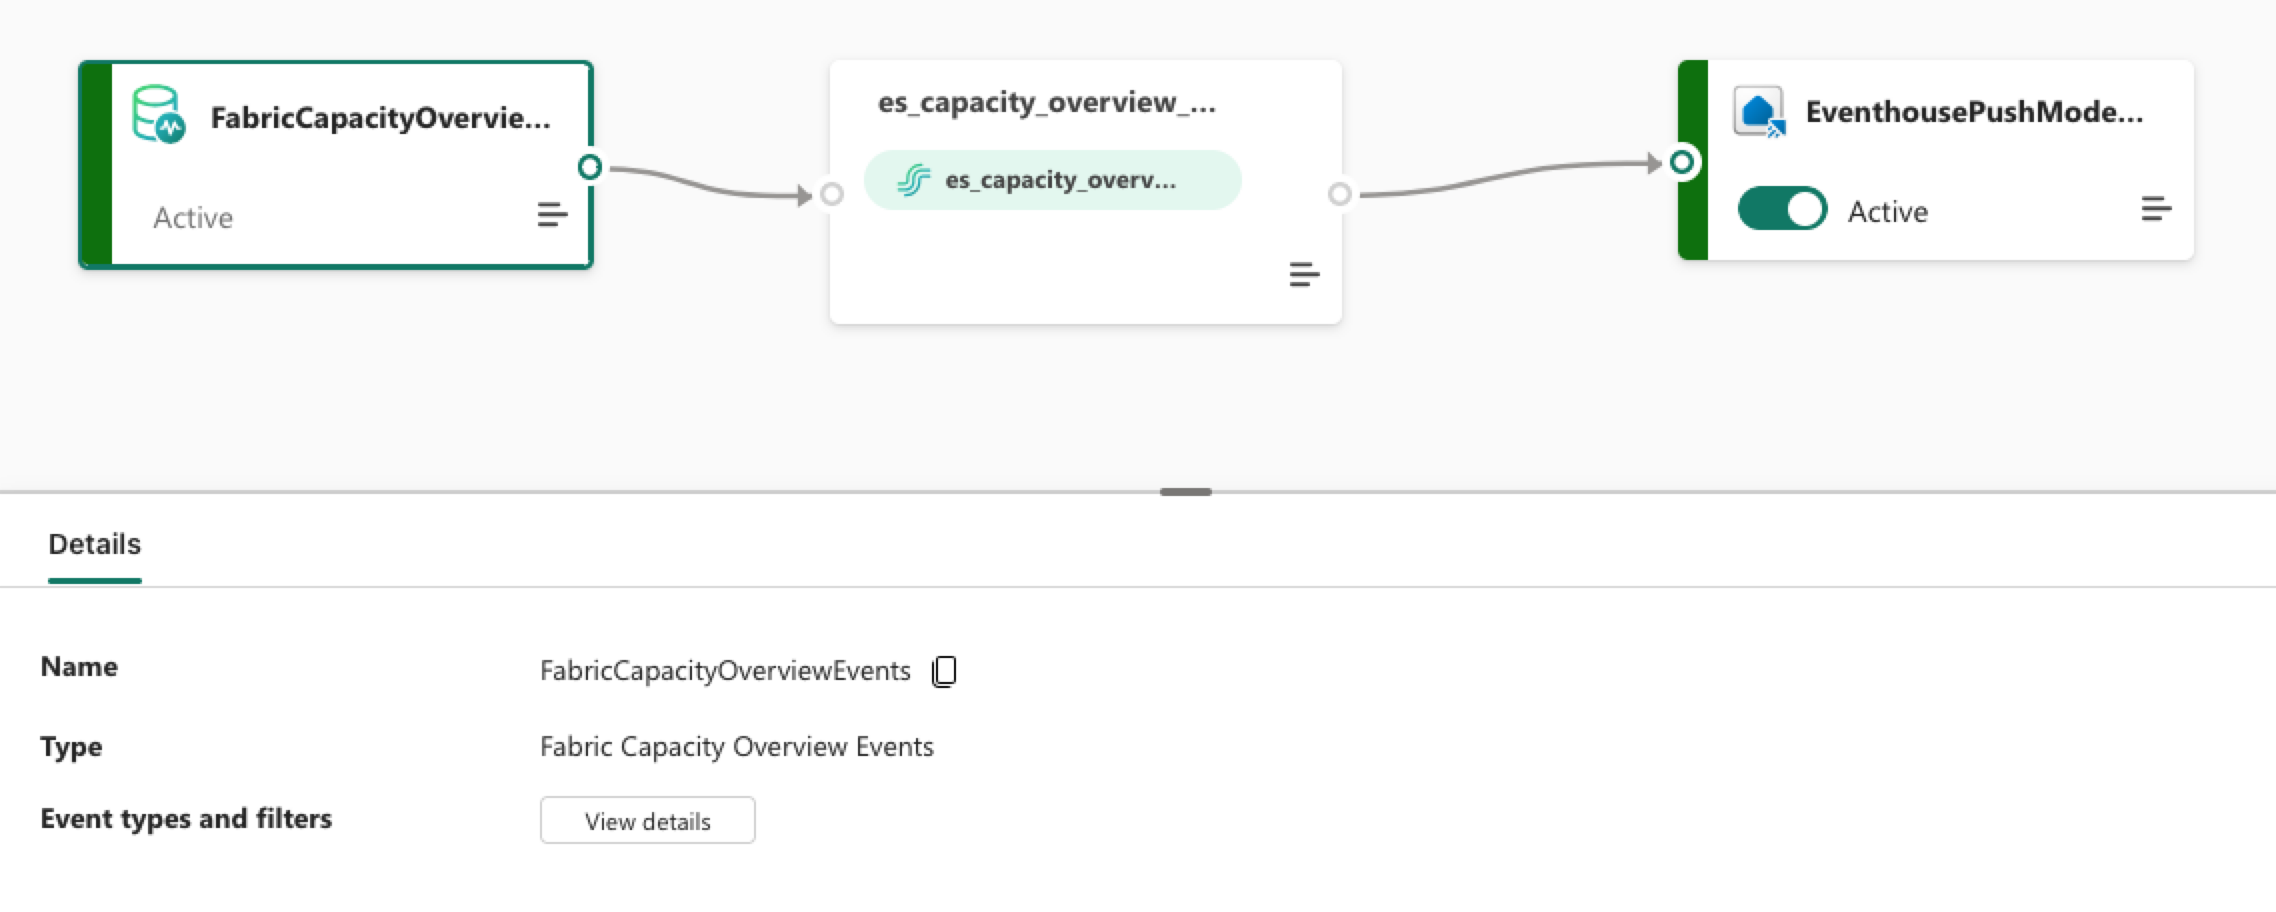
An Eventstream will subscribe to these events, Source, and make sure they’ll be stored in an Eventhouse, Target. To subscribe to these events, the service principal creating the Eventstream does need to be a Capacity Admin. Failing to do so will result in an Eventstream that’s created, but the Source is in a failed state. I had already assigned many roles via both Azure and Fabric RBAC to the workspaces, but it hadn’t occurred to me to provide the Capacity Admin permission. After doing this, the Eventstream started working.
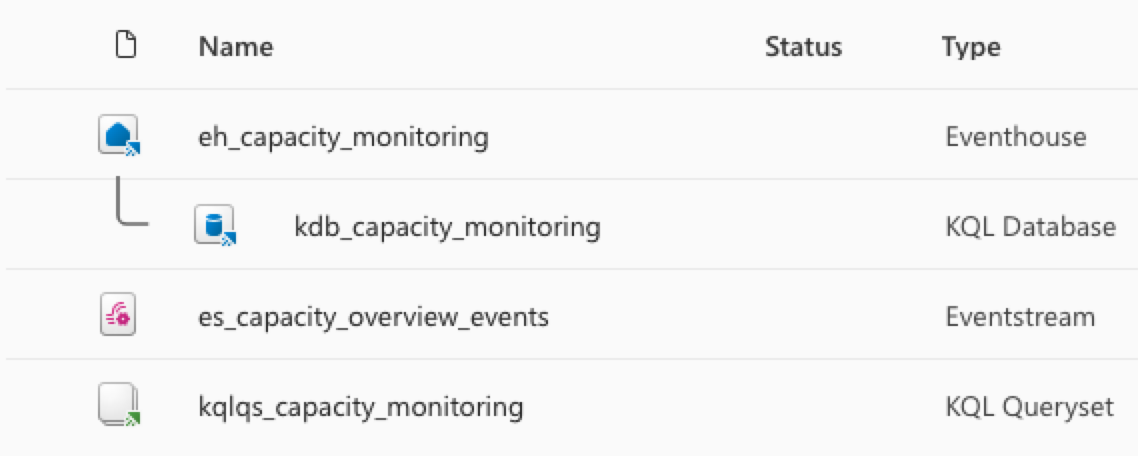
Aside from the Eventstream and Eventhouse, I also connected a KQL database and a KQL Query Set to query the events and visualize the used capacity.
What it comes down to is the following resources are being deployed:
- Eventstream handles live event ingestion.
- Eventhouse + KQL DB provide a scalable analytics store.
- KQL Query Set gives immediate operational queries and visuals.
As it turns out, you can’t reliably add the ‘Capacity Overview Events’ as a source for an Eventstream by using the regular Git integration and deployment mechanism provided in Fabric. Because of this, I had to resort to running custom scripts and split the deployment in two parts:
- Source-controlled assets (Eventhouse, KQL DB schema, query files)
- Post-deploy REST provisioning for the Eventstream/source binding
I won’t be sharing all the details of the post-deploy (Python) script here as it’s close to 1000 lines. What it does is:
- Validate if the Workspace exists
- Validate if the Eventhouse exists
- Validate if the KQL database exists
- Create the Eventstream
- Create the KQL Query Set
All steps use the Fabric REST API. After running the deployment, you should see something like the image below.
The Eventstream should look like the image below.
Query the events
With all the events stored in the Eventhouse and available via the KQL database, we can query them. The following is part of my KQL script that gets executed during deployment:
.create-merge table capacity_overview_events_raw (
    source:string,
    subject:string,
    type:string,
    ['time']:datetime,
    id:string,
    specversion:string,
    dataschemaversion:string,
    data:dynamic
)

.create-or-alter function with (folder = "capacity_monitoring") fn_capacity_summary() {
    capacity_overview_events_raw
    | where type == "Microsoft.Fabric.Capacity.Summary"
    | extend
        capacityId = tostring(data.capacityId),
        capacityName = tostring(data.capacityName),
        capacitySku = tostring(data.capacitySku),
        windowStartTime = todatetime(data.windowStartTime),
        windowEndTime = todatetime(data.windowEndTime),
        baseCapacityUnits = toint(data.baseCapacityUnits),
        capacityUnitMs = todouble(data.capacityUnitMs),
        interactiveDelayThresholdPercentage = todouble(data.interactiveDelayThresholdPercentage),
        interactiveRejectionThresholdPercentage = todouble(data.interactiveRejectionThresholdPercentage),
        backgroundRejectionThresholdPercentage = todouble(data.backgroundRejectionThresholdPercentage),
        overageTotalCapacityUnitMs = todouble(data.overageTotalCapacityUnitMs),
        overageAddCapacityUnitMs = todouble(data.overageAddCapacityUnitMs),
        overageBurndownCapacityUnitMs = todouble(data.overageBurndownCapacityUnitMs),
        utilizationBackground = todouble(data.utilizationBackground),
        utilizationInteractive = todouble(data.utilizationInteractive)
    | summarize take_any(*) by capacityId, windowStartTime, windowEndTime
    | extend capacityUnitMsBudget = todouble(baseCapacityUnits) * 1000.0 * 30.0
    | extend utilizationPct = iff(capacityUnitMsBudget == 0.0, real(null), capacityUnitMs / capacityUnitMsBudget * 100.0)
    | project-away data, capacityUnitMsBudget
}

.create-or-alter function with (folder = "capacity_monitoring") fn_capacity_state_changes() {
    capacity_overview_events_raw
    | where type == "Microsoft.Fabric.Capacity.State"
    | extend
        capacityId = tostring(data.capacityId),
        capacityName = tostring(data.capacityName),
        capacitySku = tostring(data.capacitySku),
        transitionTime = todatetime(data.transitionTime),
        capacityState = tostring(data.capacityState),
        stateChangeReason = tostring(data.stateChangeReason),
        activationId = tostring(data.activationId)
    | summarize take_any(*) by capacityId, transitionTime, stateChangeReason
    | project-away data
}

.create-or-alter function with (folder = "capacity_monitoring") fn_capacity_threshold_breaches() {
    fn_capacity_summary()
    | where interactiveDelayThresholdPercentage > 100.0
        or interactiveRejectionThresholdPercentage > 100.0
        or backgroundRejectionThresholdPercentage > 100.0
}
As you can see, I have three functions to make querying a lot easier.
With these, I can create queries like:
fn_capacity_summary()
| where windowStartTime > ago(24h)
| project windowStartTime, capacityName, utilizationPct
| order by windowStartTime asc
| render timechart
This shows the capacity usage over the past 24 hours for the selected Fabric Capacity.
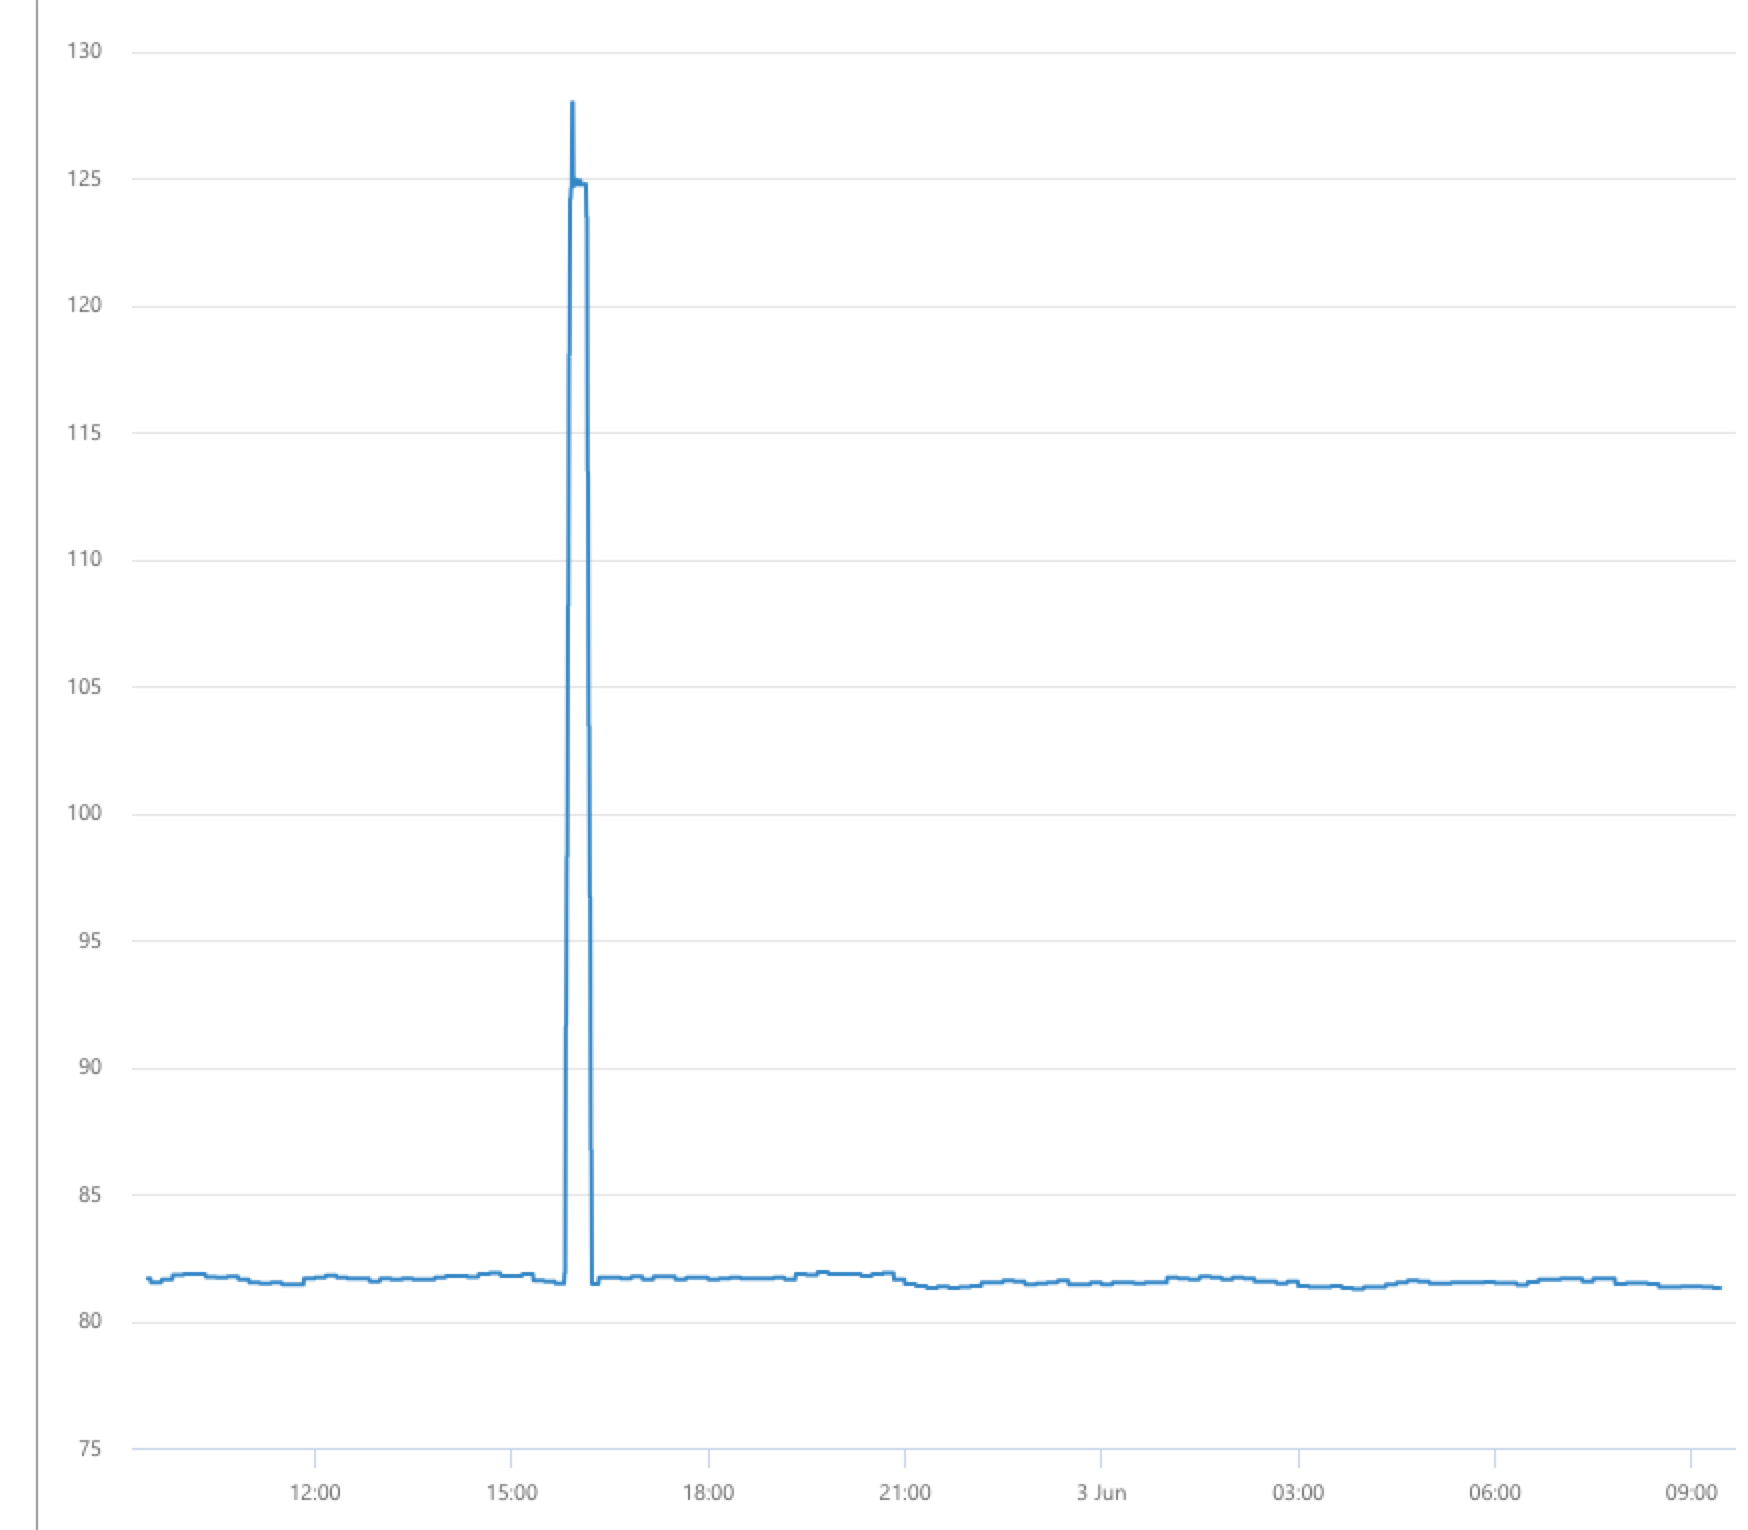
These queries and graphs can provide meaningful insights when running in Production. You probably notice there was a spike at some point above 100%. This can happen because Fabric can temporarily spike if required. After a while it will start throttling, but if it’s only a small amount of time it will continue to work.
Should you do this?
Do you need this setup?
Well, it kind of depends. The default Metrics app is quite useful, but you’re dependent on what it offers. It does come with a compelling price point: free, or about $15 per user for the Power BI Pro license if users don’t already have it.
The upside of this custom solution is that you’re in complete control over what to store and how to query it. The downside is that you have to manage all of the setup yourself, which can add up in terms of both time and money.
I found it to be a nice exercise in learning more about Microsoft Fabric, and it’s useful for my project too.